This is really a rather complex issue and is described in several sub articles
- How Geographic Information captures Phenomena
- How GeoSpatial data represents Geographic Information
- Vector Data
- Raster data
- Metadata: Describing how GeoSpatial data Represent Reality
This article need rewrite to insure that it also covers aspects such as world of discourse and ontology
When discussing how geospatial information is represented as geospatial data it is common to distinguish between two aspects of geospatial data namely attribute data and locational or geometry data. Attribute data represents the what or the properties of the geospatial information while the locational data describes the “where” aspect of the geospatial information.
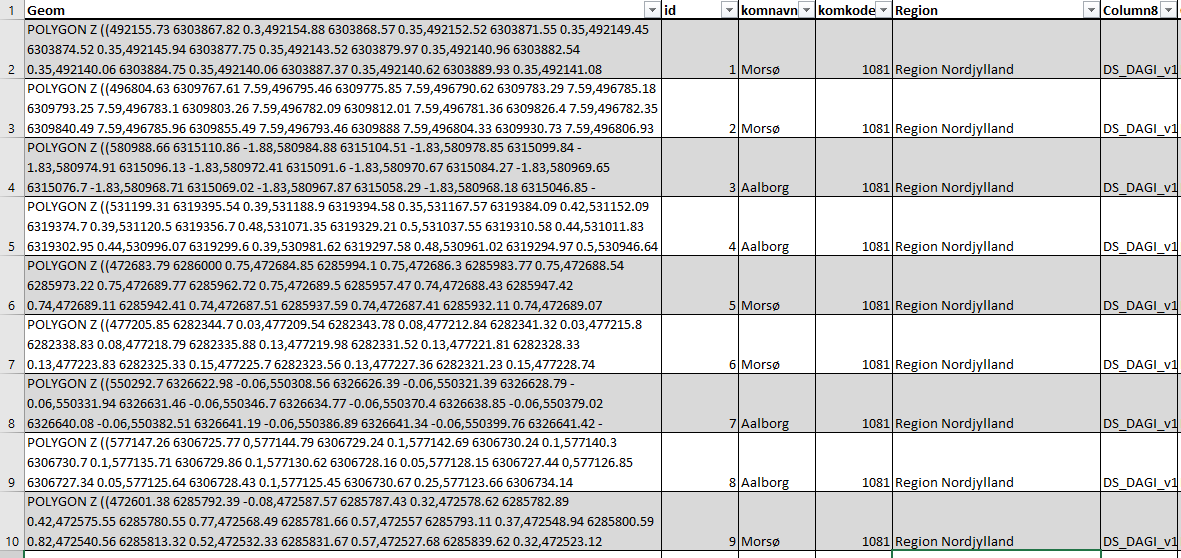
When representing entity-based information you can think of the attribute data as a table for each entity-type i.e. one table for trees and one table for houses. In these tables, each row represents an entity and each column a property e.g species, height etc. The locational data can either be represented as vector data in a separate columbine the same table as the attribute data. The locational data are represented as lists of coordinates (x,y,z), where a list of only one coordinate can represent a point. A list of several coordinates, a line such as a road and finally a list of several coordinates where the first and the last coordinate are the same can represent a polygon such as a building see Figure 1 in the post “what is geospatial information”.
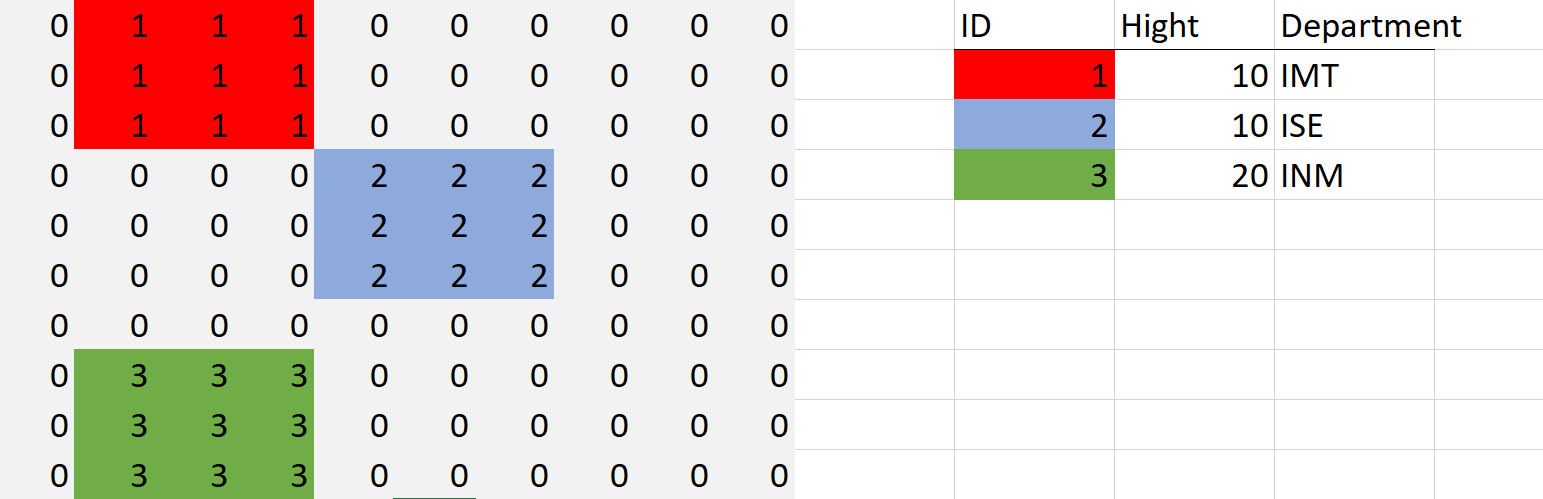
It should be pointed out that this is how data typically is presented to the user and this is not necessarily how it is done behind the scenes. An alternative to representing the locational data as vector data is to represent it as raster data. Here the spatial information is represented as a grid of cells much like a photo, each cell represents a portion of the area being represented. The value represented in each cell is a lookup value that matches a key in an attribute table see below
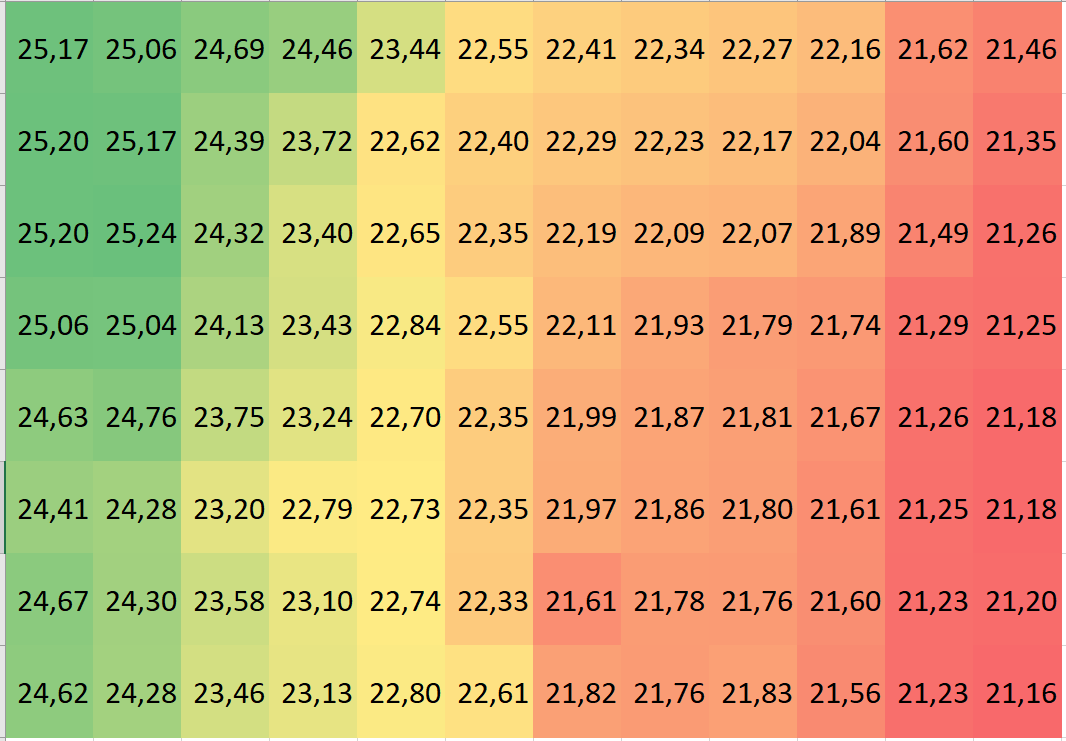
When representing property field-based information more or less the same principles are used. If vector data is used the value of the property field is defined in that point or along that line and the values between the points or lines are determined by interpolation. This principle is for instance known from maps with elevation as isolines see below. If a raster representation is used the values in the cells are typically not used as a key but to represent the property value a the centre of the raster cell, see below

While vector representation can have both x,y,z coordinates these are typically only used to represent flat objects on a surface however it is possible to create what is known as a mesh where the vector data is used to represent 3D volumes such as buildings, see below
