Creating a map with numbers and a legend explaining the numbers
![](https://usercontent.one/wp/www.geoinformatics.online/wp-content/uploads/2023/04/image.png?media=1674039083)
Create a point layer with two attributes one with the number and one with the text
![](https://usercontent.one/wp/www.geoinformatics.online/wp-content/uploads/2023/04/image-1.png?media=1674039083)
From the layer styling label, the point with the number attribute
![](https://usercontent.one/wp/www.geoinformatics.online/wp-content/uploads/2023/04/image-2.png?media=1674039083)
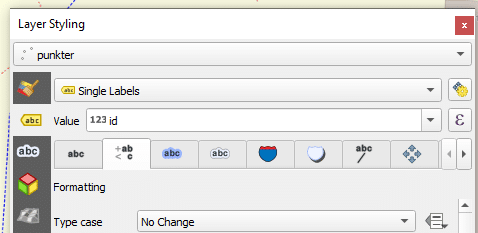
In the styling tab select categorical
![](https://usercontent.one/wp/www.geoinformatics.online/wp-content/uploads/2023/04/image-3.png?media=1674039083)
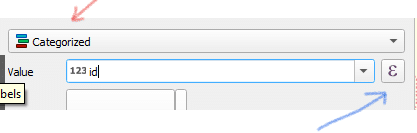
The press the calculation button (the small sigma, a soft Ɛ) then use the concatenate function concat to construct a string consisting of both the number and the Text concat( “id” ,’ : ‘, “navn” )
![](https://usercontent.one/wp/www.geoinformatics.online/wp-content/uploads/2023/04/image-4.png?media=1674039083)
When constructing the expression you find the attributes under ”Fields and Values. Note the use of double quotation marks around attributes and single quotation marks around the text’ : ’ .
When you now press classify, all points will be given different colours.
![](https://usercontent.one/wp/www.geoinformatics.online/wp-content/uploads/2023/04/image-5.png?media=1674039083)
The change them into a single colour select all legend entries and right click and choose change color
![](https://usercontent.one/wp/www.geoinformatics.online/wp-content/uploads/2023/04/image-6.png?media=1674039083)
Chose the colour you want and press the back arrow and you are done
![](https://usercontent.one/wp/www.geoinformatics.online/wp-content/uploads/2023/04/image-7.png?media=1674039083)